TL;DR: A malfunctioning speed limiter doesn’t just hand you a repair invoice. It quietly bleeds profit through compliance fines, extra fuel from overspeeding, higher insurance premiums, bigger accident exposure, and trucks sitting idle or restricted. Multiply that across your fleet and across the year, and you’re looking at a serious, recurring hit to your bottom line.
Key Takeaways
- Speed limiter downtime cost is far more than parts and labor. You’re paying in fines, fuel overconsumption, insurance surcharges, accident risk, and lost truck utilization every single day the limiter isn’t doing its job.
- A simple fleet downtime cost model lets you turn those headaches into daily and annual dollar figures per vehicle and for the whole fleet, so you can talk numbers instead of gut feel.
- MTTR (mean time to repair) and MTBF (mean time between failures) are the two reliability levers that directly shape your downtime curve and long-term cost.
- Done properly, preventive maintenance like calibration, software updates, and regular inspections usually cuts speed limiter-related costs by 40–60% compared to running until failure and reacting.
- Different failure modes like GPS sync loss, full governor failure, calibration drift, and intermittent engagement create very different risk and cost profiles that need to be modeled separately.
- A Resolute Dynamics uptime guarantee combined with a solid fleet TCO calculator makes your risk visible and helps cap it contractually at the fleet level.
- Once you put a dollar figure on your compliance gap cost, it becomes much easier to justify better hardware, smarter maintenance intervals, and real technician training to upper management.
Quick Definitions: What Is a Speed Limiter Downtime Calculator?
What is a speed limiter downtime calculator? Think of it as a purpose-built fleet cost model that shows how much money you lose whenever speed limiters or speed governors are broken, mis‑calibrated, bypassed, or offline.
It rolls up compliance fines, fuel waste from overspeeding, insurance premium impact, accident liability, and vehicle off-road or restricted-use time into a single speed limiter downtime cost figure per day, per vehicle, and for your entire fleet.
The Hidden Cost of Speed Limiter Downtime (Why It’s More Than Repair Bills)

A malfunctioning speed limiter doesn’t hurt you just once. The repair bill is the obvious hit, but the real money leaks out in lots of small streams. Every trip that runs without proper limiter protection carries compliance risk. Every kilometer at 5–15 km/h over the setpoint wastes fuel.
Each violation and each incident pushes your insurance premium upward. Every non-compliant day also bumps up your liability if a crash lands you in front of an investigator.
I see this all the time. Most fleets treat a dead speed governor as a minor nuisance. Someone logs a ticket, the shop orders a part, the tech swaps the unit or re-flashes it, and the invoice gets buried in the maintenance budget. End of story on paper.
But if you stop at the repair line item, you’re missing 70–90% of the true speed limiter failure cost that showed up before the truck even hit the workshop bay.
A solid fleet downtime cost model makes this visible. Each calendar day of speed governor downtime quietly inflates several cost buckets at once:
- Compliance risk: every loaded or revenue trip without a functioning limiter can trigger a roadside fine, an audit flag, or in stricter regions, an out-of-service order that yanks a truck off the road on the spot.
- Fuel overconsumption from speeding: drivers running without a working governor routinely creep 5–15 km/h over their normal setpoint. In practice that burns roughly 3–10% more fuel, which on a long-haul unit gets expensive very fast.
- Insurance premium impact: your insurer sees non-compliance and speeding events as risk. That’s where a recurring premium surcharge shows up at renewal, even if you only had a handful of incidents.
- Accident liability exposure: an unprotected vehicle that’s in a crash while the limiter is offline or mis‑calibrated is legal trouble waiting to happen. Plaintiffs’ lawyers and regulators love that kind of evidence.
- Maintenance opportunity cost: unplanned limiter repairs reshuffle your shop schedule. Planned work slides, more critical deferred items pile up, and the fleet’s long-term total cost of ownership (TCO) climbs.
Spread that across a couple dozen or a few hundred trucks, and the cost of a broken speed limiter dwarfs the price of the device itself. That’s why a structured speed limiter downtime calculator isn’t just a spreadsheet exercise. It becomes a key decision tool that lets you argue for budget and policy changes using hard numbers.
Why fleets underestimate downtime cost
Most managers don’t lowball downtime cost on purpose. They’re just flying with bad or incomplete inputs. Three blind spots show up over and over during audits and TCO reviews:
- “Repair-only” mindset: they track technician hours and parts cost, then stop there. Compliance fines, audit exposure, and crash liability never get tied back to specific downtime events, so those costs feel random instead of predictable.
- No link to utilization: dispatch treats the unit as “available” as long as it physically moves, even if it’s non-compliant or restricted to low-risk work. The true vehicle off-road time is buried under partial utilization and workarounds.
- Poor failure logging: nobody records when the limiter first failed or started drifting, only when the truck finally hit the shop. Without clear timestamps, every cost model ends up based on best guesses and wishful thinking. (If you want to fix that, start by tightening up your failure logging workflow.)
Once you run those gaps through a proper downtime calculator and add dollar values, the hidden cost jumps out. That’s usually when leadership stops treating limiters as cheap accessories and starts viewing them as risk-control hardware tied directly to profit and loss.
Speed Limiter Downtime Cost Formula (Calculate Your Fleet Exposure)
Daily cost formula:
Daily cost = (fine risk × trips/day) + (fuel waste × km/day) + (insurance surcharge ÷ 365) + (accident liability exposure ÷ 365) + (vehicle off-road opportunity cost).
That looks abstract on its own, so let’s turn it into something you can plug into a speed limiter ROI calculation or drop straight into a fleet downtime calculator you already use for other systems.
1. Define cost components for one vehicle
Start at the unit level. For a single vehicle running with a failed or ineffective limiter, define each cost element clearly. You want to be able to adjust these numbers based on your routes, local regulations, and fuel prices.
- Cfine – Compliance fine risk per day (USD)
= Compliance fine per violation × probability of inspection or detection × trips per day
Example: if a typical compliance fine per violation is $400, there’s a 10% chance of being inspected on a trip, and the truck does 2 trips per day:
$400 × 0.10 × 2 = $80/day in expected fine risk. - Cfuel – Fuel overconsumption cost per day (USD)
= (Baseline fuel cost/day) × (Fuel waste speeding surcharge %)
Say the truck burns $200 of fuel per day at the proper limited speed. If the missing limiter adds a realistic fuel waste speeding surcharge of 6%:
0.06 × $200 = $12/day in wasted fuel. - Cins – Insurance premium impact per day (USD)
= Annual insurance premium surcharge ÷ 365
Suppose your insurer hits you with an extra $18,250/year across 50 similar vehicles because of limiter-related non-compliance. That’s $365 per vehicle per year:
$365 ÷ 365 ≈ $1/day added to that unit’s cost structure. - Cacc – Accident liability exposure per day (USD)
= (Average incremental liability if limiter is offline) × (Probability of at‑fault crash per day)
If your legal team estimates that having the limiter offline adds $500,000 in potential extra liability during a crash, and the chance of an at-fault crash is 0.005% per day (0.00005):
0.00005 × $500,000 = $25/day in expected liability exposure. - Coff – Vehicle off-road opportunity cost per day (USD)
= (Profit contribution per day) when the vehicle is parked or limited to low-risk, low-margin work
If that truck normally contributes $350/day in net margin and you sideline it or restrict it because the limiter isn’t right, you’re eating roughly $350/day in lost profit.
Per-vehicle daily cost:
Cdaily = Cfine + Cfuel + Cins + Cacc + Coff
Using the example values: 80 + 12 + 1 + 25 + 350 = $468/day per vehicle with a failed or non-compliant limiter.
Now you’ve got a daily number that blends fines, fuel, insurance, risk, and lost utilization into one metric you can move up or down with better decisions.
2. Apply fleet multipliers (fleet downtime exposure)
One truck at $468/day hurts. A fleet of a few hundred trucks at anything close to that gets painful very quickly. That’s where fleet-wide downtime exposure terms come in.
- N = total vehicles in fleet (e.g., 500)
- %issues = percentage of vehicles that experience limiter issues in a year
- Davg = average downtime or exposure per incident (days), including the non-compliant days before the shop visit
- Incidents/year/vehicle = number of failures per vehicle per year, drawn from MTBF
Annual downtime cost (fleet):
Cannual,fleet = Cdaily × N × %issues × Davg × (Incidents/year/vehicle)
Drop in some realistic values and you get something you can show your CFO:
- N = 500 vehicles
- %issues = 10% (about 50 units in the fleet see at least one limiter failure annually)
- Davg = 3 days of effective downtime or non-compliant exposure per incident
- Incidents/year/vehicle = 0.5 (roughly half the trucks see a failure every year)
Cannual,fleet = $468 × 500 × 0.10 × 3 × 0.5 ≈ $35,100 per year
And that’s just the expected annual burn before you factor in the tail events like a major crash or a large regulatory audit failure cost. One serious case with clear limiter non-compliance can easily dwarf that annual figure by 5–10 times.
3. Add MTTR and MTBF to your formula
Your two big knobs for changing the cost curve are mean time to repair (MTTR) and mean time between failures (MTBF). They plug straight into the model and give you clean levers to pull in a fleet TCO calculator or any other scenario tool you use.
- Davg ≈ MTTR
The longer your MTTR, the longer you’re stuck paying that daily downtime cost. Shaving a day off MTTR is worth whatever Cdaily you calculated for each truck. - Incidents/year/vehicle ≈ 365 ÷ MTBF (in days)
A higher MTBF means fewer failures per vehicle each year. That directly reduces the number of events where that daily cost gets applied.
For example, if you drop MTTR from 3 days to 1 day, you chop roughly two-thirds of the downtime per incident. Double MTBF from 12 months to 24 months and you halve the number of failures you pay for in a given year. When you plug these into your model, you can run quick “what if” passes and show exactly how much each reliability improvement is worth.
4. Hidden insights most calculators miss
Most off‑the‑shelf calculators gloss over deeper risk. Here are three areas that deserve their own line items in your speed limiter downtime calculator:
- Compliance gap cost: the clock doesn’t start when the truck rolls into the shop. It starts when the limiter first fails or drifts. That detection gap can be days or weeks. If you only count shop time, you’re underestimating by a wide margin.
- Maintenance opportunity cost: every urgent limiter job bumps scheduled work. That domino effect shows up later as bigger failures on brakes, tires, or electronics that you didn’t have time to service on schedule.
- Audit-triggered costs: recurring limiter issues raise your profile with regulators. Once you hit their radar, you’re looking at more frequent inspections, a harsher regulatory fine schedule, and a bunch of administrative man-hours assembling documents and attending hearings.
Cost Breakdown by Failure Type
Not every limiter problem hits you the same way. Some failures drop you straight into full non-compliance with high-speed risk. Others are slow leaks in the background. To make your speed limiter downtime calculator honest, you need to segment by failure type instead of averaging everything into one bland number.
The table below shows typical per‑vehicle cost ranges per day for different failure modes. These are ballpark figures in USD, but they give you a starting point to tune for your own operation.
| Failure Type | Compliance Risk | Fuel Waste | Accident Exposure | Est. Daily Cost / Vehicle |
|---|---|---|---|---|
| GPS sync loss | Low–Medium (data gap) | Low | Low–Medium | $50–$120 |
| Complete governor failure | Very High (full non-compliance) | High | Very High | $300–$600 |
| Calibration drift | Medium (gradual overspeed) | Medium | Medium | $120–$250 |
| Intermittent engagement failure | Unpredictable (hard to defend) | Medium–High | High | $200–$400 |
Those ranges mix hard costs with expected risk cost. In practice, I recommend you track which failure types show up in your own fleet and adjust the numbers after a few months of data.
GPS sync loss: partial data gap
With GPS sync loss, the physical governor might still cap the speed correctly, so drivers don’t feel much difference. The trouble is on the paperwork side. You’re now dealing with a compliance data gap, which matters a lot if regulators or insurers come knocking.
- You might only have partial or missing speed logs over certain segments or days.
- After an incident, proving the truck was compliant turns into a messy exercise in reconstruction.
- Repeat gaps will push up your regulatory audit failure cost because authorities start to suspect broader non-compliance.
Cost drivers here aren’t so much fuel or physical downtime; they’re admin and risk:
- If inspectors treat missing data the same as non-compliance, you’re suddenly facing a real compliance fine per violation on trips where the logs don’t line up.
- Your fleet risk exposure in claims or disputes increases because your best defense, the data, is weak or missing.
- Back-office staff spend hours reconstructing routes, pulling camera footage, or digging through fuel receipts to fill the gap.
Complete governor failure: full compliance exposure
This is the nightmare scenario. The speed limiter simply doesn’t limit. Drivers can run as fast as the truck and conditions allow, and the hardware won’t stop them. Here you’re fully exposed across the board.
- You’re wide open to speeding tickets, roadside violations, and sanctions on almost every trip until the fault is found and fixed.
- Fuel overconsumption speeding is now very real. Seeing 5–10% extra fuel burn is common with an ungoverned right foot, especially on long highway legs.
- Your accident liability unprotected vehicle risk shoots through the roof. In a serious crash, investigators will absolutely check whether speed-limiting devices were working.
- In strict jurisdictions, you may face out-of-service orders, impoundment, or mandatory inspections for the whole fleet.
This failure type delivers the highest speed limiter failure cost on a per-day basis. Your calculator should flag this mode in bright red and push repair priority to the top of the queue whenever one is detected.
Calibration drift: slow, invisible cost creep
Calibration drift is the sneaky one. Solid calibration prevents drift from snowballing into compliance fines and fuel waste. On paper, the limiter works. It just lets the truck run a few kilometers per hour faster than spec, or it kicks in a bit late. Drivers often don’t report it because the truck still feels governed, just a bit better.
- That small but persistent overspeed bumps up your chance of speed-related fines, especially on tightly enforced corridors.
- Fuel consumption creeps up by a couple of percentage points. Across a year of operation and a few hundred trucks, that creep turns into real money.
- Some insurers will interpret frequent drift as weak maintenance control, nudging your insurance premium surcharge higher.
The main weapon against drift is a structured calibration schedule tied to your service intervals. If you formalize the procedure and ensure your technicians follow it, your calculator will show that the long-term savings outweigh the time spent. For technical step-by-steps on calibration and reset, see the dedicated calibration resources linked in your maintenance program.
Intermittent engagement failure: worst of both worlds
Intermittent engagement is what gives technicians gray hair. The limiter works sometimes, then randomly doesn’t. Drivers complain, then the truck behaves during the test drive. Risk-wise, this is ugly.
- Intermittent faults are hard to reproduce, so MTTR stretches. You end up with repeat shop visits and more diagnostic hours than anyone budgeted for.
- Drivers stop trusting the limiter. They may push speeds more aggressively, figuring the system isn’t reliable anyway, which affects overall safety culture.
- In a post-crash investigation, ghost logs that show the limiter working some of the time are much harder to defend than a clean, obvious failure you repaired promptly.
These failures come with higher maintenance opportunity cost because you burn a lot of shop time chasing the issue. Your compliance gap cost is also higher because you genuinely don’t know which trips were protected and which weren’t. Using advanced diagnostics and detailed event logs can help you diagnose issues faster and cut down on repeat road tests.
MTTR and MTBF: Reliability Metrics That Drive Fleet Cost
MTTR and MTBF sit underneath every speed limiter downtime cost model. Once you understand how they behave in your fleet and how to move them, you can shift your entire total cost of ownership curve instead of fighting one failure at a time.
What is MTTR for speed limiters?
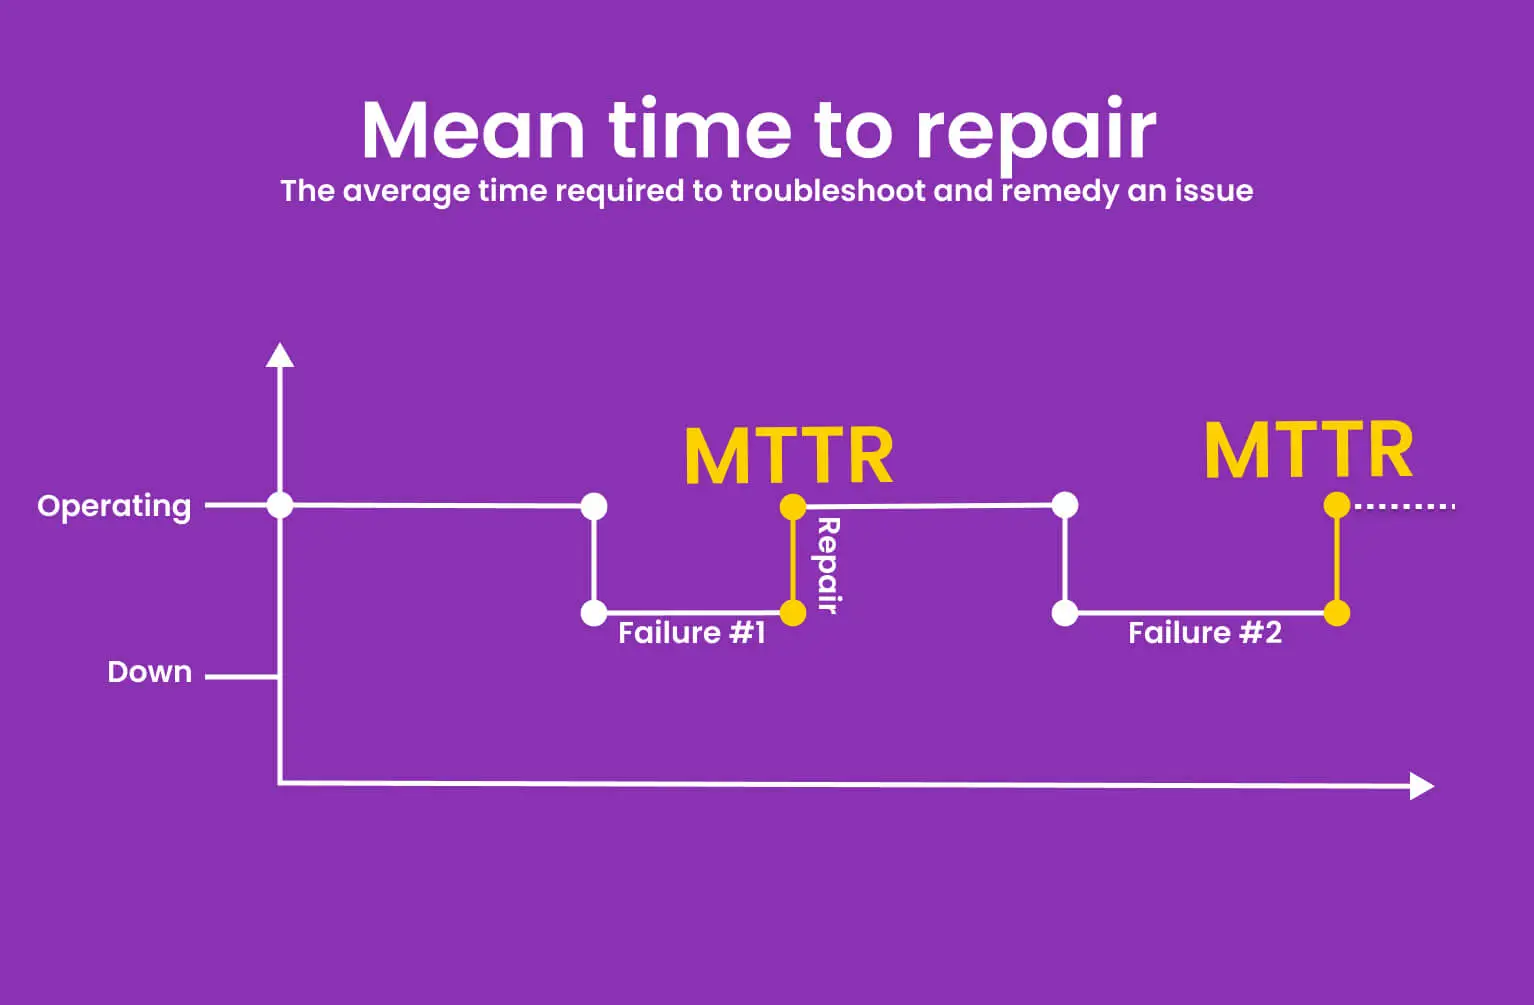
MTTR (Mean Time To Repair) is the average time it takes you to get a failed speed limiter back to fully working, verified condition. Not time in the bay, but the whole interval from failure ticket to proven fix. For limiters, MTTR usually includes several pieces:
- Diagnosis time (hours): tracking down whether it’s the device, the harness, sensors, ECU config, GPS feed, or something else in the chain.
- Parts procurement (days): waiting for replacement units, harnesses, or interface modules to arrive from your supplier if they’re not on the shelf.
- Repair labor (hours): technician time to swap units, repair wiring, reconfigure software, or update firmware.
- Verification drive (hours): road test and log review to make sure the limiter actually engages correctly and records data the way regulators expect.
Here’s what a typical MTTR breakdown looks like in real fleets:
| MTTR Component | Typical Value |
|---|---|
| Diagnosis time | 2–4 hours |
| Parts procurement | 1–3 days |
| Repair labor | 1–3 hours |
| Verification drive | 1–2 hours |
| Total MTTR typical | 2–4 days (calendar) |
Every one of those calendar days multiplies the daily downtime cost you calculated earlier. If your Cdaily is high, cutting MTTR from 4 days to 2 days is like putting several hundred dollars per incident straight back into your pocket.
What is MTBF for speed limiters?
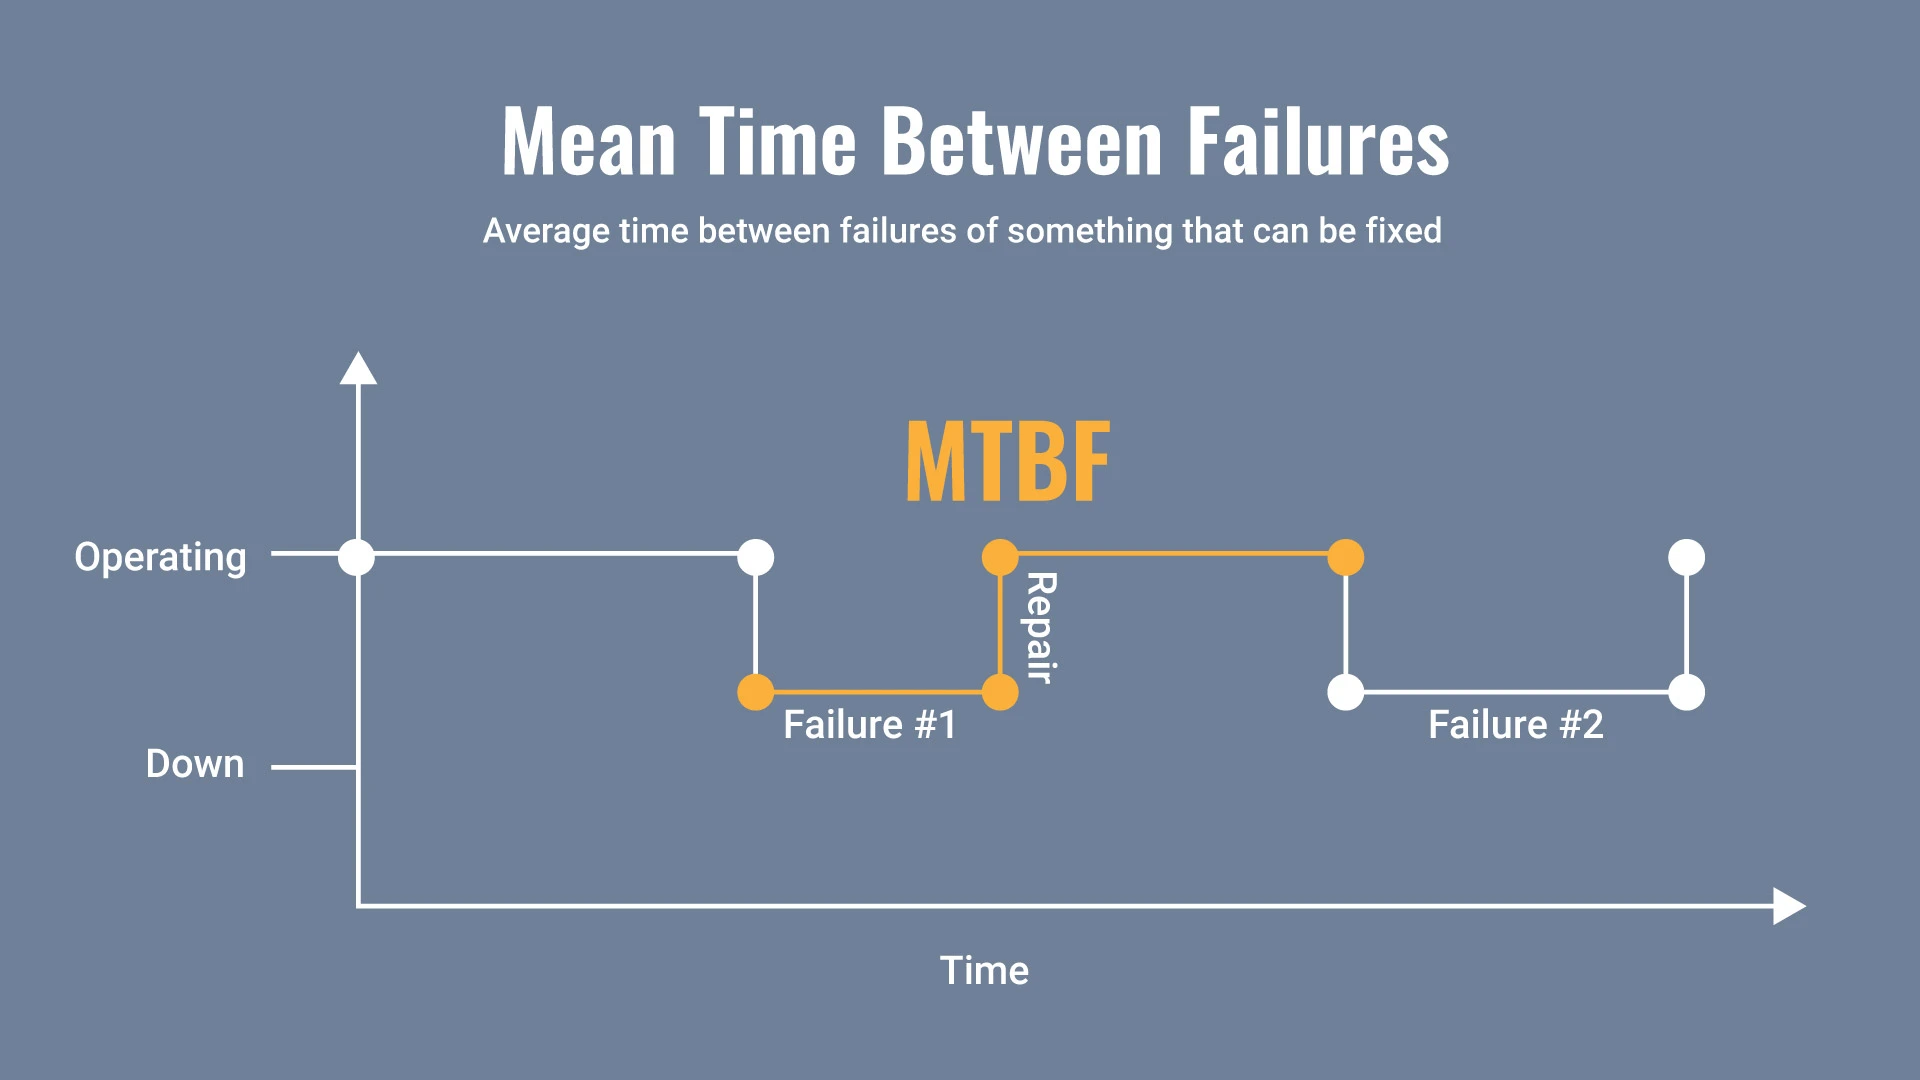
MTBF (Mean Time Between Failures) describes how often a typical speed limiter fails under real-world use. Higher MTBF means fewer failures per year and fewer chances for downtime and fines to pile up. MTBF is shaped by several factors:
- Device reliability (years): the quality of the hardware design, components, and assembly. Cheap units often look fine on day one and then start failing early.
- Environmental factor: trucks running in extreme heat, salt, dust, or vibration-heavy duty cycles will see lower MTBF than identical hardware in milder conditions.
- Firmware update impact: good updates fix defects and stabilize operation, improving effective MTBF. Poor update practices or skipped updates drag reliability down.
- Fleet average (months): your actual field data across all vehicles. This trumps whatever is printed in a spec sheet.
Typical MTBF attributes look like this in many mixed-use fleets:
| MTBF Attribute | Typical Range |
|---|---|
| Device reliability | 5–10 years (under normal use) |
| Environmental factor | Harsh environments can halve MTBF |
| Firmware update impact | May reset or improve MTBF if defects fixed |
| Fleet average MTBF | 12–36 months between incidents |
Improvement methods:
- Make inspection and cleaning of connectors a standard line item during regular services so corrosion and vibration damage don’t go unnoticed.
- Stay current on firmware updates from your limiter OEM, especially those flagged as reliability or stability fixes.
- Standardize on more rugged, higher-spec hardware for harsh routes like mining runs, heavy off-road, or extreme climate regions.
- Train installers and technicians carefully so they avoid pinched harnesses, bad grounds, and other installation-induced failures that hurt MTBF.
How MTTR and MTBF change your TCO curve
Once you plug MTTR and MTBF into your model, you’ll notice how strongly they shape your total cost of ownership (TCO) for speed governors and the trucks they protect.
- Lower MTBF (frequent failures) means more incidents and more chances to pile up fines, fuel waste, and off-road days. Even if each repair is fast, the annual cost stays stubbornly high.
- High MTTR (slow repairs) means each failure drags out. Fewer incidents maybe, but you live with each one longer. That also creates more volatility in your fleet utilization rate and dispatch planning.
- Improve MTTR & MTBF together and you dramatically shrink both the number of failures and how long each one hurts. That’s where you finally see the 40–60% cost reduction your calculator promises.
Contracts like a Resolute Dynamics uptime guarantee are built right around these two metrics. By committing to tight MTTR and MTBF targets, part of your risk effectively moves to the supplier’s shoulders, and your downtime cost becomes more predictable and easier to budget.
Preventive vs Reactive Maintenance ROI for Speed Limiters
Preventive maintenance on speed limiters, like calibration, inspections, and firmware management, often looks like extra work on the schedule.
Many fleets push it out or skip it entirely until something breaks. Once you run those choices through a downtime calculator, you’ll see that preventive work is usually one of the highest-return investments in your safety and compliance budget.
Preventive maintenance cost vs reactive repair cost
Start by pricing out your preventive maintenance cost on a per-vehicle, per-year basis. Keep it simple but honest.
- Annual calibration cost per vehicle (USD): often $80–$150 per unit depending on your shop rates and procedure complexity.
- Firmware update cost: if done centrally and during planned service, this may be bundled. Otherwise, budget $20–$50 per manual update for time and admin overhead.
- Inspection cost per vehicle (USD): typically $50–$100 if you fold limiter checks into periodic maintenance inspections.
For most mixed fleets, total annual preventive cost per vehicle settles around:
Total annual preventive ≈ $150–$300
Now compare that with the typical reactive repair average when you only touch limiters after they fail:
- Technician labor: $150–$300 per incident, especially if diagnosis is messy.
- Parts: $150–$400 per limiter or related harness and modules.
- Expedited shipping: $50–$150 when you need it tomorrow to get a revenue unit back on the road.
- Compliance fines during downtime: commonly $200–$800 per incident if the failure lasted across multiple trips before detection.
- Lost utilization (1–3 days at $300/day): $300–$900 in missed margin while the truck is grounded or restricted.
That stacks up to a reactive total per incident of roughly $850–$2,550. With even 0.5 incidents per year per vehicle, your reactive-only strategy costs $425–$1,275 per year. That’s often two to four times what a disciplined preventive program would run.
Preventive vs reactive: impact on fleet-wide downtime exposure
Things really get interesting when you roll these approaches up to the fleet. For a 500‑vehicle operation, actual exposure often falls into ranges like this:
| Exposure Attribute | Reactive Strategy | Preventive Strategy |
|---|---|---|
| Vehicles with active issues (% fleet) | 10–15% | 3–5% |
| Average downtime per incident (days) | 3–5 days | 1–2 days |
| Annual cost – 500-vehicle fleet | $50,000–$120,000 | $20,000–$60,000 |
| Cost reduction with preventive | – | 40–60% |
| Compliance gap closure rate | Slow, reactive | Fast, proactive |
Preventive work cuts incidents and shortens each downtime window. It also gives you side benefits that don’t always show up directly in the cash column:
- You close compliance gaps early, so by the time an audit or roadside check hits, your limiter records are clean and recent.
- You improve fleet utilization rate because limiter work happens during planned low-demand windows instead of emergency call-outs.
- You walk into insurer meetings with documented controls and trend data, which is one of the few real levers you have to negotiate lower risk-based premiums.
If you’re debating whether to swap or repair on failure, you’ll want to model how much downtime cost you rack up by keeping marginal units in service. For a deeper dive into that replacement vs repair tradeoff, see how delayed replacement often costs more than buying new hardware upfront.
Calculating ROI for preventive maintenance
You don’t need a fancy tool for this part. A straightforward speed limiter ROI calculation tells the story clearly:
ROI (%) = ((Reactive cost – Preventive cost) ÷ Preventive cost) × 100
Example for one vehicle over one year:
- Preventive cost = $250
- Reactive cost (downtime, fines, repairs) = $750
- ROI = ((750 – 250) ÷ 250) × 100 = 200% ROI
Multiply that across 500 units and you’re suddenly talking six-figure savings every year, not counting softer gains like fewer injuries, better driver morale, and a stronger brand reputation with customers and regulators.
Three expert tips competitors rarely mention
- Align maintenance with insurance renewals: time your limiter calibration campaigns and documentation updates so you can walk into renewal meetings with fresh, clean reports. That’s how you cut your insurance premium impact instead of just arguing on price.
- Prioritize high-risk duty cycles: don’t waste equal effort everywhere. Focus tighter inspection intervals and higher-end hardware on routes with harsh weather, extreme terrain, or stricter enforcement, where limiter failures cost you the most.
- Use failure logs strategically: well-structured logs not only help you log failures for insurance and legal defense, they also back up warranty claims and give you solid data to push OEMs into fixing recurring design problems.
Common Mistakes in Calculating Speed Limiter Downtime Cost (and How to Fix Them)
- Mistake 1: Only counting workshop time as downtime
Fix: Start your clock at failure, not at bay entry. Count every day from the first fault or non-compliant reading until the limiter is verified as fixed. Those on-road but broken days are where most of your compliance gap cost stacks up. - Mistake 2: Ignoring fuel overconsumption from speeding
Fix: Add a realistic fuel waste speeding surcharge of 3–10% to your model based on telematics or fuel benchmarks. Even on modest duty cycles, that extra fuel quickly becomes one of the heftier costs of running without proper speed control. - Mistake 3: Leaving accident liability out of the equation
Fix: Work with safety and legal teams to estimate accident liability exposure per day when the limiter is offline. Use your historical crash frequency and layer in the extra exposure from non-compliance. Even a small probability multiplied by a big claim number changes the math. - Mistake 4: Treating all failure types the same
Fix: Break your events into GPS loss, full failure, drift, and intermittent issues. Assign different probabilities and daily costs to each. That’s how you get a realistic speed limiter downtime cost profile instead of a useless one-size-fits-all average. - Mistake 5: No link between MTBF and maintenance policy
Fix: Use MTBF reliability metrics from your own data, not marketing brochures, to set preventive intervals and decide where to carry spare units. Shorter MTBF on certain models or routes should trigger more aggressive preventive strategies and replacement plans. - Mistake 6: Underestimating parts procurement delay
Fix: Don’t assume parts are always on the shelf. Build typical parts procurement delay into your MTTR. For critical duty cycles, stock key limiter components in-house or negotiate priority shipping SLAs with your suppliers to shrink that waiting period. - Mistake 7: Not monetizing regulatory and audit risk
Fix: Add a specific line for regulatory audit failure cost. Estimate legal fees, management time, potential fines, and revenue lost from any imposed restrictions. Then spread that expected cost across your estimated audit probability. Once it’s in dollars, it’s easier to justify stronger controls.
FAQ: Speed Limiter Downtime, Fines, and ROI
This section directly supports FAQ schema.
How much downtime does a typical speed limiter failure cause?
In most real fleets, a single speed limiter failure creates about 2–4 days of effective downtime. That includes diagnosis, waiting on parts, installing and configuring the fix, and doing a verification drive. If you count days where the truck is on the road but non-compliant or restricted because the fault hasn’t been caught yet, the true exposure window can stretch longer, especially in operations with weaker detection and logging.
What are typical compliance fines for speed limiter violations?
Compliance fine per trip varies by region, enforcement intensity, and whether you’re a repeat offender. In many jurisdictions, per-violation fines land between $200 and $1,500. Repeat offences, high-speed violations, or crashes tied to excessive speed can push those numbers far higher, and some regimes layer in company-level penalties, demerit points, or out-of-service orders. All of that feeds into your overall speed limiter compliance cost.
How does a broken speed limiter affect fleet insurance premiums?
Insurers don’t just look at crashes. They look at how you manage risk. A history of limiter-related violations, data gaps, or non-compliance tells them your speed controls aren’t under control. That’s when you see an insurance premium surcharge of 5–20% or even more, depending on your loss history. On a large fleet, that can add tens or hundreds of thousands of dollars a year on top of whatever you already paid in downtime and fines.
What is the ROI timeline for preventive speed limiter maintenance?
Most fleets that commit to proper calibration, inspections, and updates see positive ROI within the first 12 months. Once you compare your annual preventive spend against avoided fines, reduced emergency repairs, and lower downtime, you often land in the 100–300% ROI range. Many of those savings show up quickly as fewer breakdowns and cleaner audit results.
How can I justify speed limiter investment to management?
Tie safety and compliance directly to financial outcomes. Use a fleet TCO calculator to show what you’re currently spending on downtime, violations, and limiter-related repairs. Then model improved MTTR, higher MTBF, and reduced fleet-wide downtime exposure if you upgrade hardware, tighten maintenance, and partner with a supplier that offers a strong Resolute Dynamics uptime guarantee. Present the payback period, yearly savings, and quantified risk reduction. Executives respond to payback and risk, not just better safety.
Are all speed limiter failures equally risky for my fleet?
No, they’re not even close. Full governor failures have the highest daily cost because they hit you on all fronts at once: non-compliance, fuel waste, and high accident exposure. Calibration drift looks minor but creates a constant background bleed in fuel and fine risk. GPS sync problems and intermittent engagement mainly damage your ability to defend yourself in audits and claims. Your downtime model should treat these as distinct buckets with different cost and probability numbers.
How does MTBF affect my annual speed limiter downtime cost?
MTBF governs how many failure events you see in a year. If your MTBF is 12 months, you’re averaging one incident per year per affected unit. If you stretch MTBF to 24 months, you cut that incident rate roughly in half. Since each incident carries downtime, fines, and fuel waste, this directly cuts your annual cost, relieves pressure on your technicians, and reduces how many spares you need to hold in inventory.
Can better data logging really reduce my downtime cost?
Yes. Good data logging dramatically tightens both diagnosis and defense. On the technical side, clean event logs and telematics let you spot patterns, pinpoint fault conditions, and diagnose issues faster without endless road tests. On the compliance side, complete records help you prove you reacted promptly and were compliant on specific trips, which reduces fines and premium surcharges. Data is what turns MTTR and your legal risk from guesswork into something you can actively manage.
Final Summary: Turn Downtime into a Measurable, Manageable Cost
Speed limiter downtime is not just a workshop nuisance. It’s a quiet, recurring drain on profit through fines, wasted fuel, insurance hikes, crash exposure, and trucks that aren’t earning what they should. A structured speed limiter downtime calculator turns all that from “we know it hurts” into clear numbers per day, per vehicle, and for the entire fleet.
Build a realistic fleet downtime cost model, plug in your MTTR and MTBF, and shift from reactive repairs to a planned preventive program. Most fleets that follow through see limiter-related costs drop by 40–60% while safety, compliance, and insurer confidence all move in the right direction.
Practical next steps:
- Use the formulas above to quantify your current downtime cost, even if you start with rough estimates and refine over time.
- Pinpoint which failure types and processes give you the longest MTTR. Parts procurement, poor logging, and intermittent issues are usually the worst offenders.
- Review your calibration and inspection intervals, then fix gaps that drive missed calibration downtime cost and repeat failures.
- Evaluate limiter suppliers on real reliability metrics, support quality, and uptime guarantees, not just unit price on a spec sheet.
Once downtime is counted and monetized, you can treat it like any other operating cost. You can manage it, trim it, and hold vendors and internal teams accountable. That’s how you turn speed limiter issues from a silent profit leak into a controlled, optimized part of your fleet’s total cost of ownership.
Related reading: Log Failures for Legal/Insurance and ROI of Speed Limiters for Logistics.

The Resolute Dynamics team designs and manufactures speed limiters (SLD), GPS tracking, and automotive safety systems used on 200,000+ vehicles across 20+ countries. We write about fleet compliance, road-safety regulation, and vehicle-safety technology, including Malaysia’s JPJ SLD mandate, UAE RTA rules, and global standards like UN R89, to help fleet operators and transport businesses stay safe and compliant.